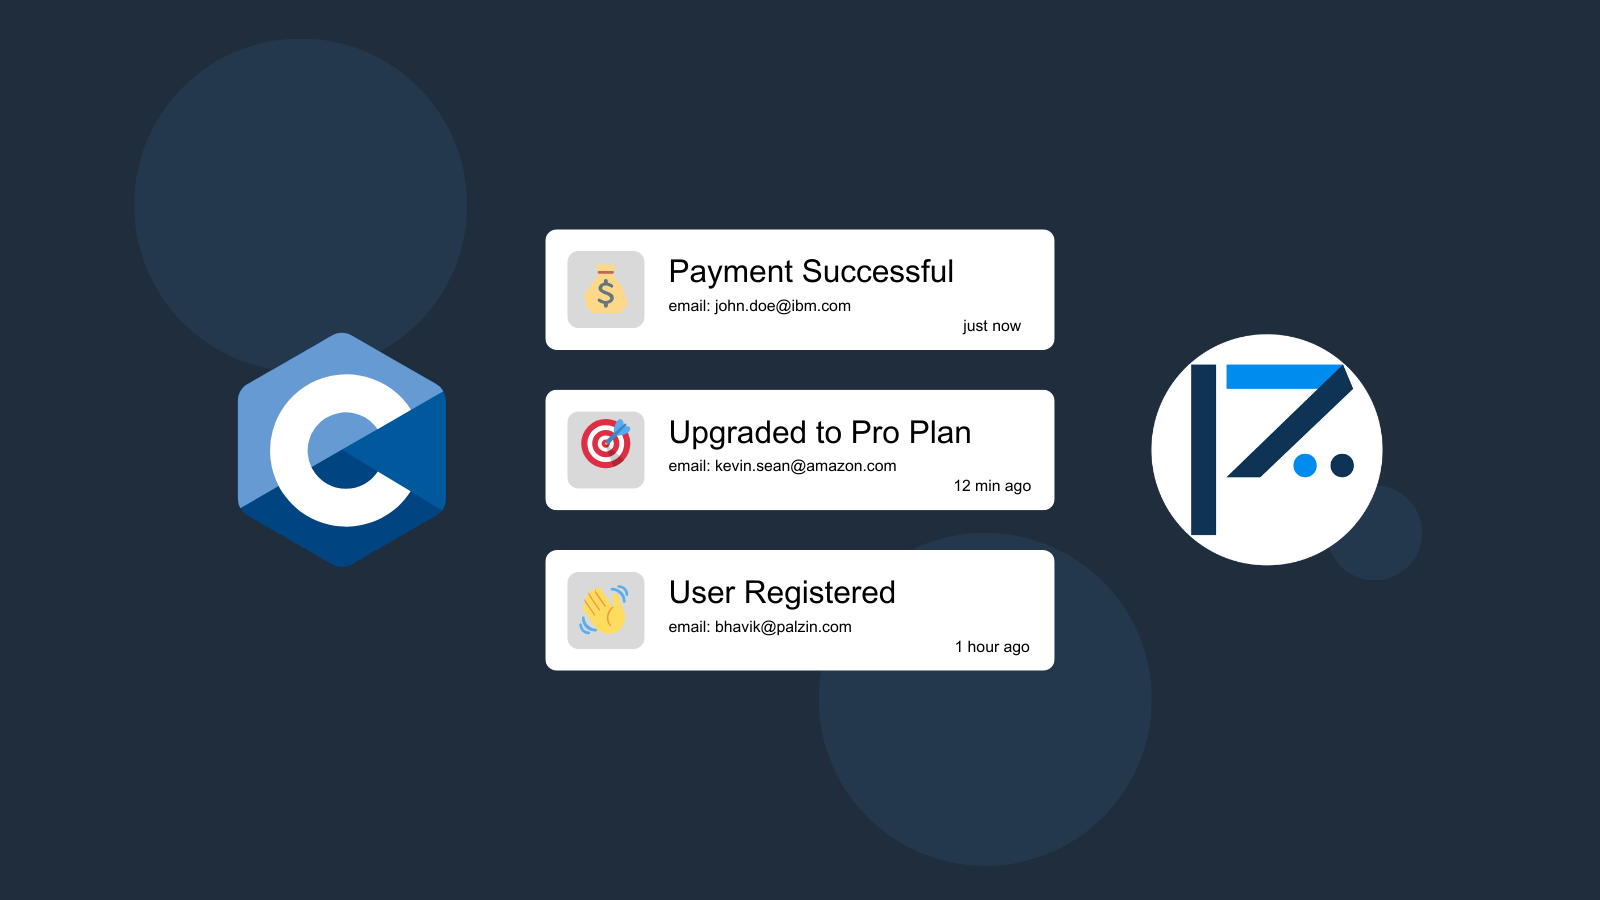
In the realm of C applications, a recurring challenge we encounter relates to memory leaks and overall memory utilization. This issue assumes particular significance when developing applications destined for deployment in the cloud, whether as serverless functions, containers, or virtual machines. In such scenarios, excessive memory consumption can disrupt application performance, potentially leading to crashes and increased operational costs.
To mitigate these concerns, it is imperative to monitor the memory usage of our C applications and implement a robust tracking system with predefined thresholds. This proactive approach ensures ongoing performance awareness. For instance, if memory usage exceeds a predetermined threshold, such as 80 percent, immediate corrective actions can be taken to preempt more significant issues.
To address this, we introduce Palzin Track, a potent event tracking tool seamlessly compatible with C. With Palzin Track, you gain the capability to monitor various application events in real-time, including real-time tracking of memory usage. Moreover, you can configure notification rules to promptly alert your team and yourself when memory usage surpasses specified thresholds via push notifications. This vigilance ensures that you maintain a constant pulse on your application's performance, facilitating swift responses when necessary.
You can use the following code snippets to track memory usage in your C application. Please don't forget to replace the YOUR_API_TOKEN with your API token and update the project and channel names.
Using C with libcurl
CURL \*curl;


CURLcode res;


curl = curl_easy_init();


if(curl) {


 curl_easy_setopt(curl, CURLOPT_CUSTOMREQUEST, "POST");


 curl_easy_setopt(curl, CURLOPT_URL, "https://api.palzin.live/v1/log");


 curl_easy_setopt(curl, CURLOPT_FOLLOWLOCATION, 1L);


 curl_easy_setopt(curl, CURLOPT_DEFAULT_PROTOCOL, "https");


 struct curl_slist \*headers = NULL;


 headers = curl_slist_append(headers, "Content-Type: application/json");


 headers = curl_slist_append(headers, "Authorization: Bearer YOUR_API_TOKEN");


 curl_easy_setopt(curl, CURLOPT_HTTPHEADER, headers);


 const char \*data = "{\"project\":\"my-project\",\"channel\":\"status\",\"event\":\"High Memory Usage\",\"description\":\"Memory usage has exceeded the threshold.\",\"icon\":\"🚨\",\"notify\":true}";


 curl_easy_setopt(curl, CURLOPT_POSTFIELDS, data);


 res = curl_easy_perform(curl);


}


curl_easy_cleanup(curl);
Palzin Track is a powerful and flexible event tracking tool that works surprisingly well with C applications. It provides powerful features such as real-time event tracking, cross-platform push notifications, user and product journeys, charts and analytics, and more.
Connect Palzin Track to your C application in minutes and start tracking events in real-time. Palzin Track provides a generous free plan to get you started with event tracking. You can also check out our pricing page to see our paid plans. So please give us a try and let us know what you think!
Palzin Track reveals the human stories behind your data. Make user-centric decisions that drive growth.