As software developers, we are constantly seeking ways to enhance our Shell products. Our primary focus is on delivering more value to our users and enhancing their overall experience.
One approach that's frequently discussed is the use of "feature flags." Feature flags provide a mechanism to activate or deactivate specific features within your application. This functionality serves as a valuable tool for testing new features and ensuring they perform as expected before a broader release to users.
However, introducing a new feature is only the initial step in the process. Once the feature is deployed, it becomes crucial to validate its adoption and utility among our user base. We must confirm whether the feature is actively utilized and delivering benefits to our users.
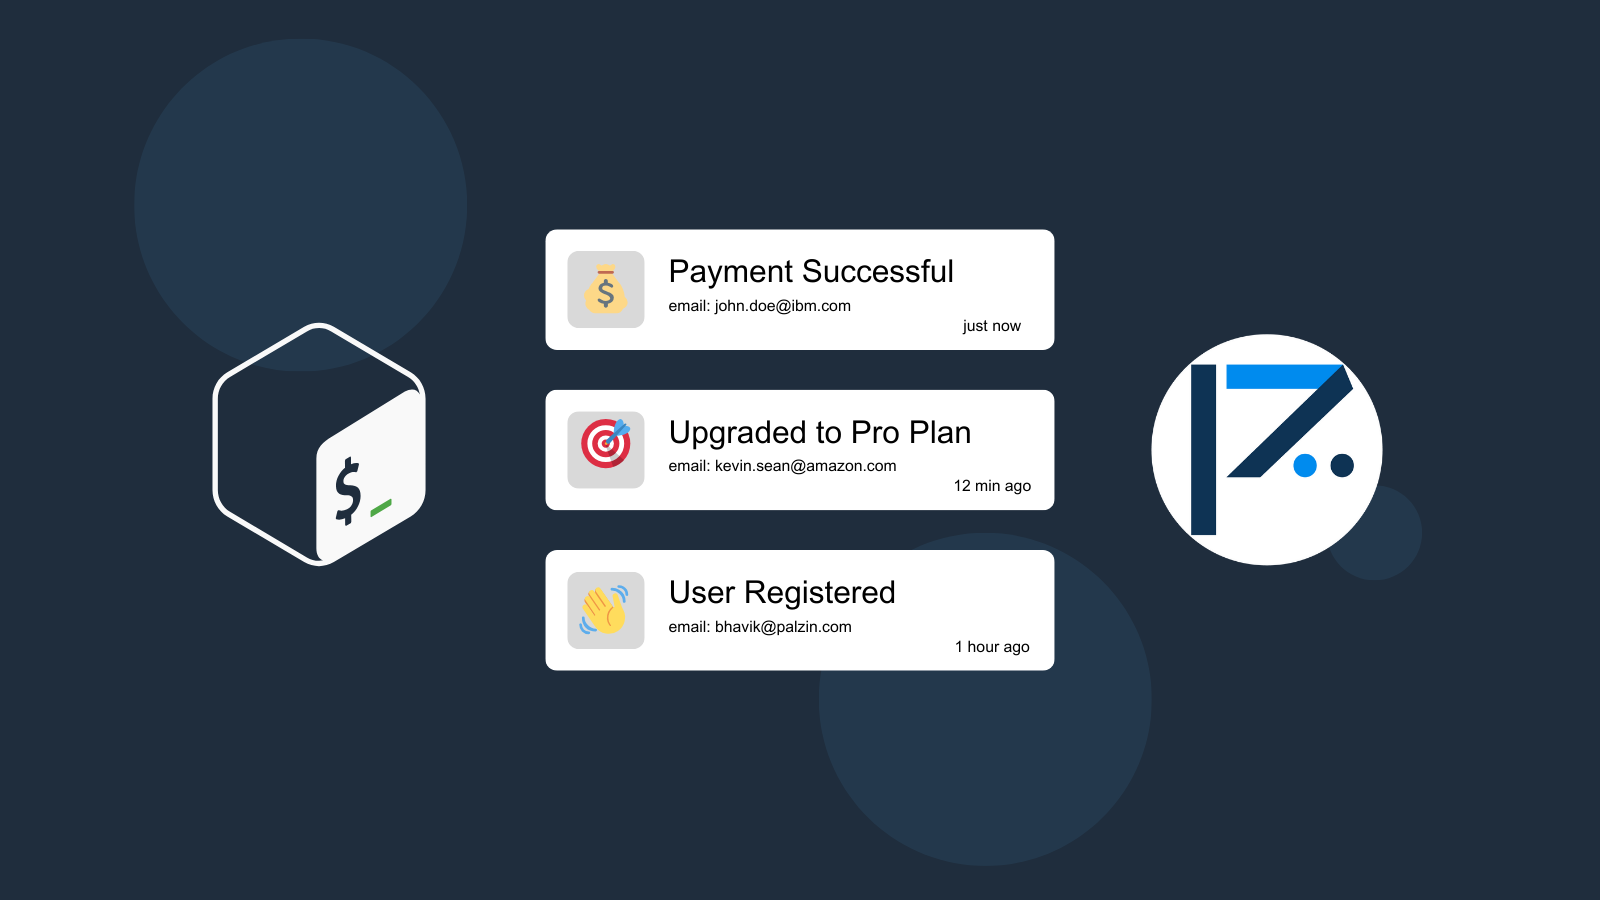
In this context, Palzin Track emerges as an invaluable solution. It simplifies the integration of event tracking within your Shell application and provides real-time monitoring capabilities. With Palzin Track, you can effortlessly track essential events in your application and closely monitor user interactions following the introduction of a new feature.
Consider an example where you are developing a Shell application that enables users to upload files. You wish to introduce a new feature allowing users to share these files directly with others. Palzin Track can be employed to monitor when a user shares a file with another user. This data can be leveraged to gauge the frequency of feature usage and even delve deeper by tracking user journeys to understand how users engage with it.
Simply use the following code snippets to monitor your new features using Palzin Track. Make sure to replace the YOUR_API_TOKEN with your API token and update the project and channel names.
Using Shell with Httpie
printf '{"project":"my-project","channel":"features","event":"User Shared File","description":"User shared a file with another user","icon":"📩","notify":true}'| http --follow --timeout 3600 POST 'https://api.palzin.live/v1/log' \


 Content-Type:'application/json' \


 Authorization:'Bearer YOUR_API_TOKEN'
Using Shell with wget
wget --no-check-certificate --quiet \


 --method POST \


 --timeout=0 \


 --header 'Content-Type: application/json' \


 --header 'Authorization: Bearer YOUR_API_TOKEN' \


 --body-data '{"project":"my-project","channel":"features","event":"User Shared File","description":"User shared a file with another user","icon":"📩","notify":true}' \


 'https://api.palzin.live/v1/log'
Palzin Track is a use-case agnostic event tracking tool that easily integrates with any Shell application. It offers robust functionalities like live event tracking, push notifications across various platforms, event categorization, tracking user and product paths, visual charts, analytics, and numerous other capabilities.
Here at Palzin Track, we believe that event tracking should be easy and accessible to everyone, and that's why we have made it trivial to integrate with your Shell application. Setting up Palzin Track is a quick process, requiring just a few minutes, enabling you to commence event tracking promptly.
We offer a generous free plan to help you begin your event tracking experience. Explore our pricing page to find details about our paid plans. Feel free to give us a try, and we'd love to hear your thoughts!.
Palzin Track reveals the human stories behind your data. Make user-centric decisions that drive growth.