Prioritize User Retention: Empower Growth with Actionable Insights from Palzin Track
Reduce churn, cultivate loyalty, and build a thriving user base with the power of user retention analysis in Palzin Track.
In the competitive SaaS landscape, user retention is the lifeblood of sustainable growth. It measures how effectively you engage users and keep them coming back to your product over time. Palzin Track equips you with comprehensive user retention tools and insights to understand user behavior, identify churn risks, and implement data-driven strategies to foster long-term user loyalty.
Demystifying User Retention
User retention reflects the percentage of users who return to your product after a specific timeframe following signup or first use. It signifies the portion of your user acquisition efforts that translates into a loyal and recurring customer base.
Why User Retention Matters in SaaS
User retention has a profound impact on every crucial SaaS business metric:
-
Revenue Growth: Retained users contribute to recurring revenue streams, ensuring financial stability and facilitating future product development.
-
Customer Lifetime Value (CLTV): Retaining users extends their customer lifecycle, increasing their overall value to your business.
-
Marketing Efficiency: Reduced churn minimizes the need for constant user acquisition efforts to maintain a healthy user base.
Leveraging Palzin Track for User Retention Analysis
Palzin Track empowers you to delve deep into user retention with a robust set of features:
-
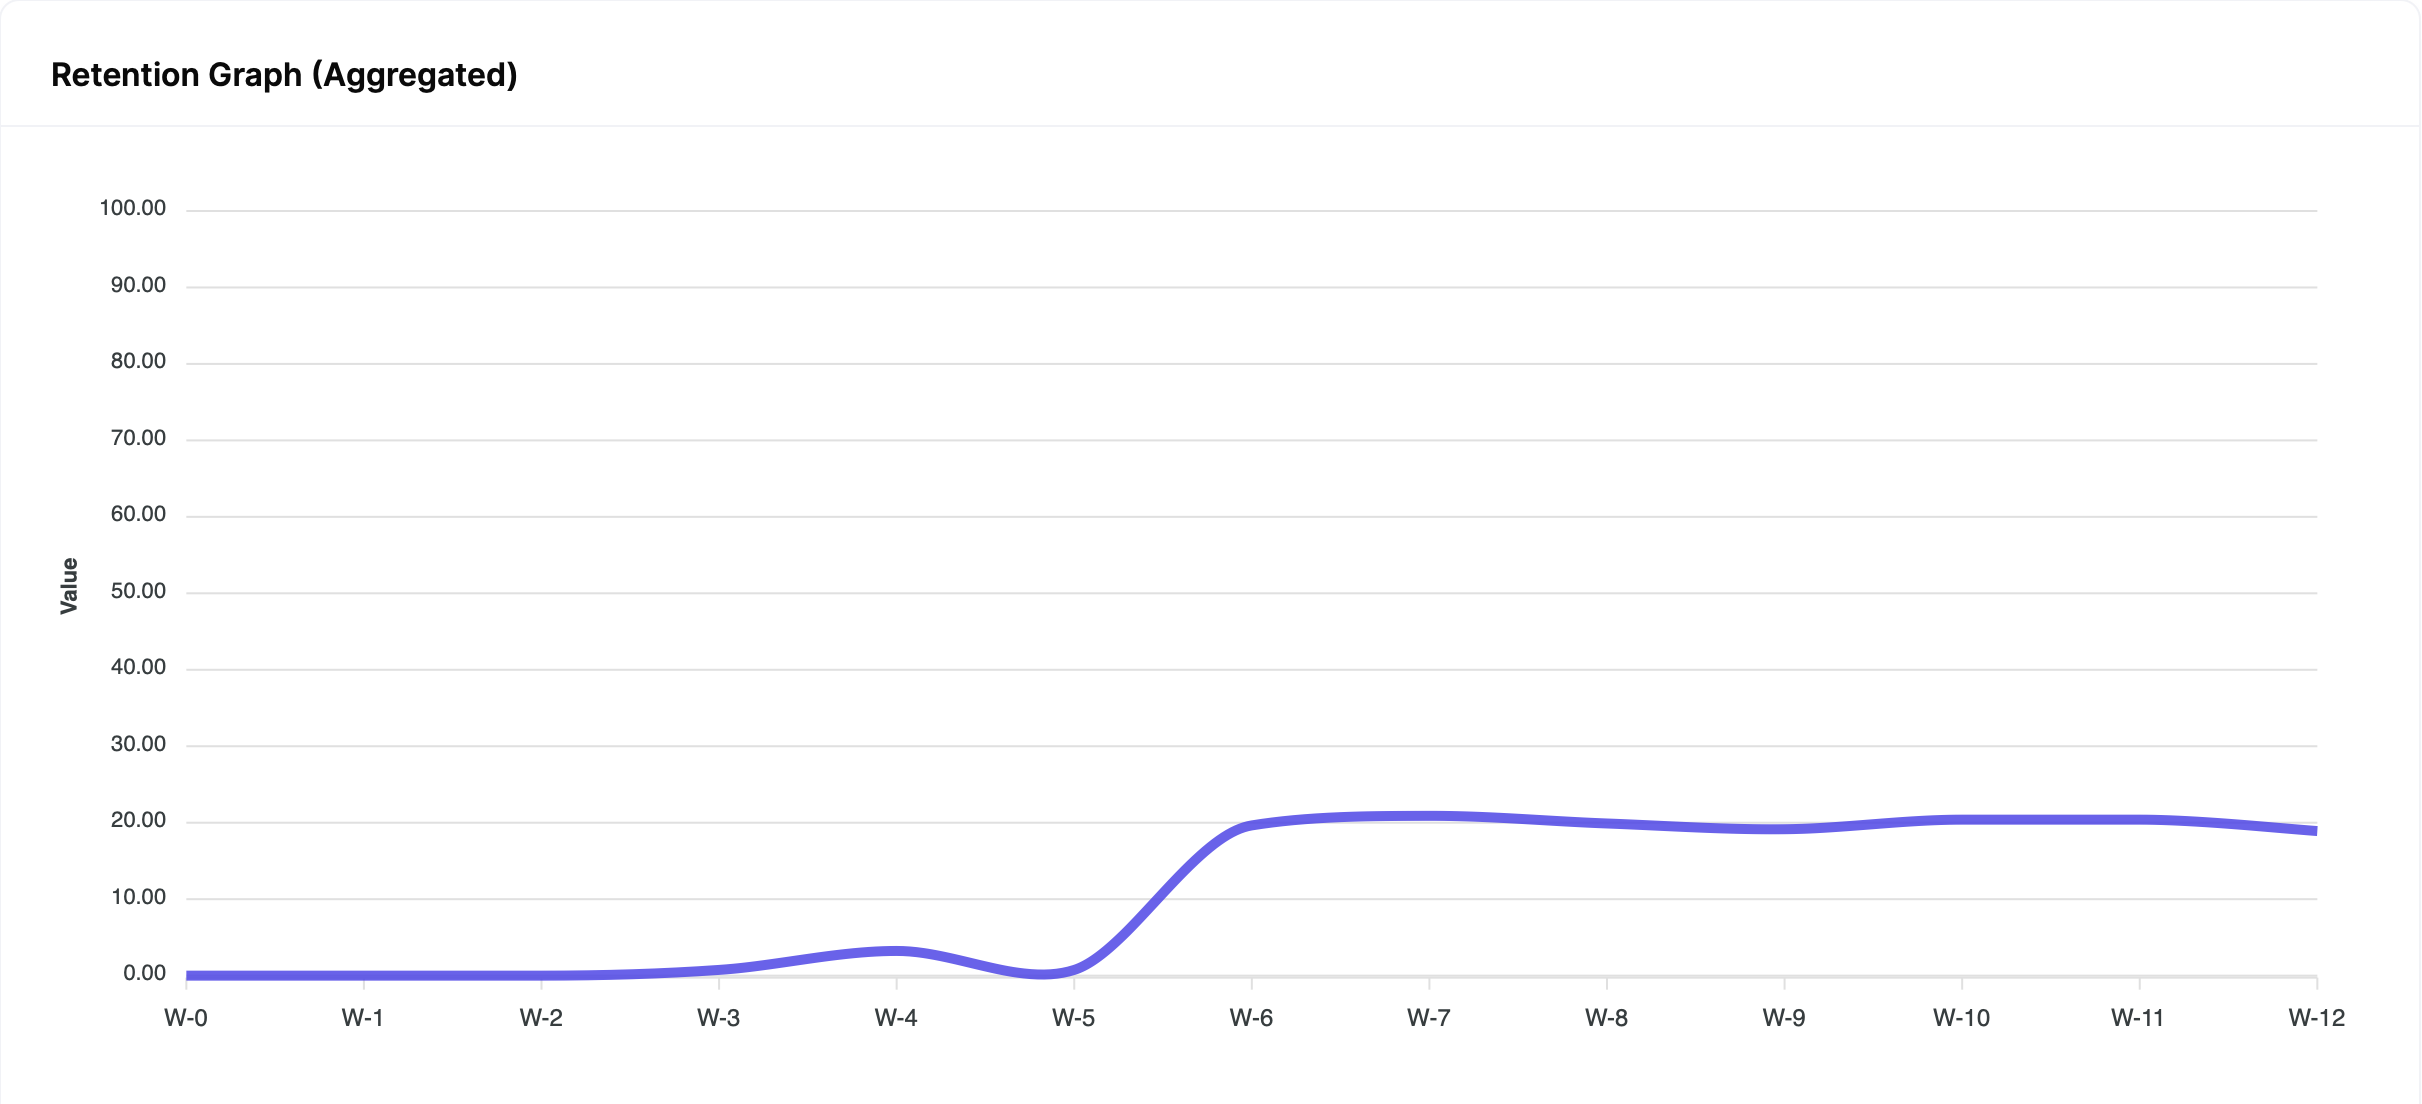
Retention Curves: Visualize how user engagement wanes over time, identifying critical drop-off points and areas for improvement.
-
User Segmentation: Group users based on demographics, subscription plans, feature usage, or other relevant criteria. Analyze retention rates for different segments to identify at-risk cohorts.
-
Cohort Analysis: Track user behavior over time for specific acquisition cohorts (e.g., users acquired in a particular month). This helps identify patterns and potential churn risks within specific user groups.
-
Funnel Analysis: Visualize user journeys within key functionalities to pinpoint areas where users abandon workflows, leading to potential churn.
-
Event Tracking: Define specific user actions that signify engagement and value realization. Track retention rates based on these actions to understand what keeps users coming back for more.
Palzin Track goes beyond raw data by providing:
-
User Feedback Integration: Integrate user feedback surveys or in-app chat data with Palzin Track to understand why users churn and identify areas for product improvement.
-
A/B Testing: [link to A/B Testing] Utilize user behavior data from Palzin Track to inform A/B tests of onboarding experiences, feature functionalities, or user interfaces. This allows you to see which versions improve user engagement and retention.
Strategies to Enhance User Retention with Palzin Track Insights
By analyzing user retention data in Palzin Track, you can implement data-driven strategies to keep users engaged and loyal:
-
Optimize Onboarding: Ensure new users have a smooth and positive first experience. Provide clear value propositions, highlight core functionalities, and guide users towards successful product adoption.
-
Deliver Value Consistently: Continually update your product with new features, bug fixes, and improvements that enhance user experience and address evolving needs.
-
Personalize User Journeys: Leverage user data from Palzin Track to personalize product recommendations, content, and communication for different user segments, increasing user satisfaction and engagement.
-
Foster User Engagement: Implement loyalty programs, gamification elements, or exclusive content to incentivize continued product usage and create a sense of community.
By prioritizing user retention with Palzin Track, you can transform user acquisition efforts into a loyal and thriving user base. This translates to sustainable growth, improved customer lifetime value, and a competitive edge in the SaaS market.
Benchmark
Here's a quick reference for user retention benchmarks across various industries:
Target Retention Rates:
These targets are flexible based on your business model, but aim for 40% retention in the first month and 20% after a year.
Medians:
The medians represent average industry performance, but use them with your target benchmarks.
Remember: Benchmarks vary by source. Continuously monitor your rates and adjust strategies as needed.
Explore More: