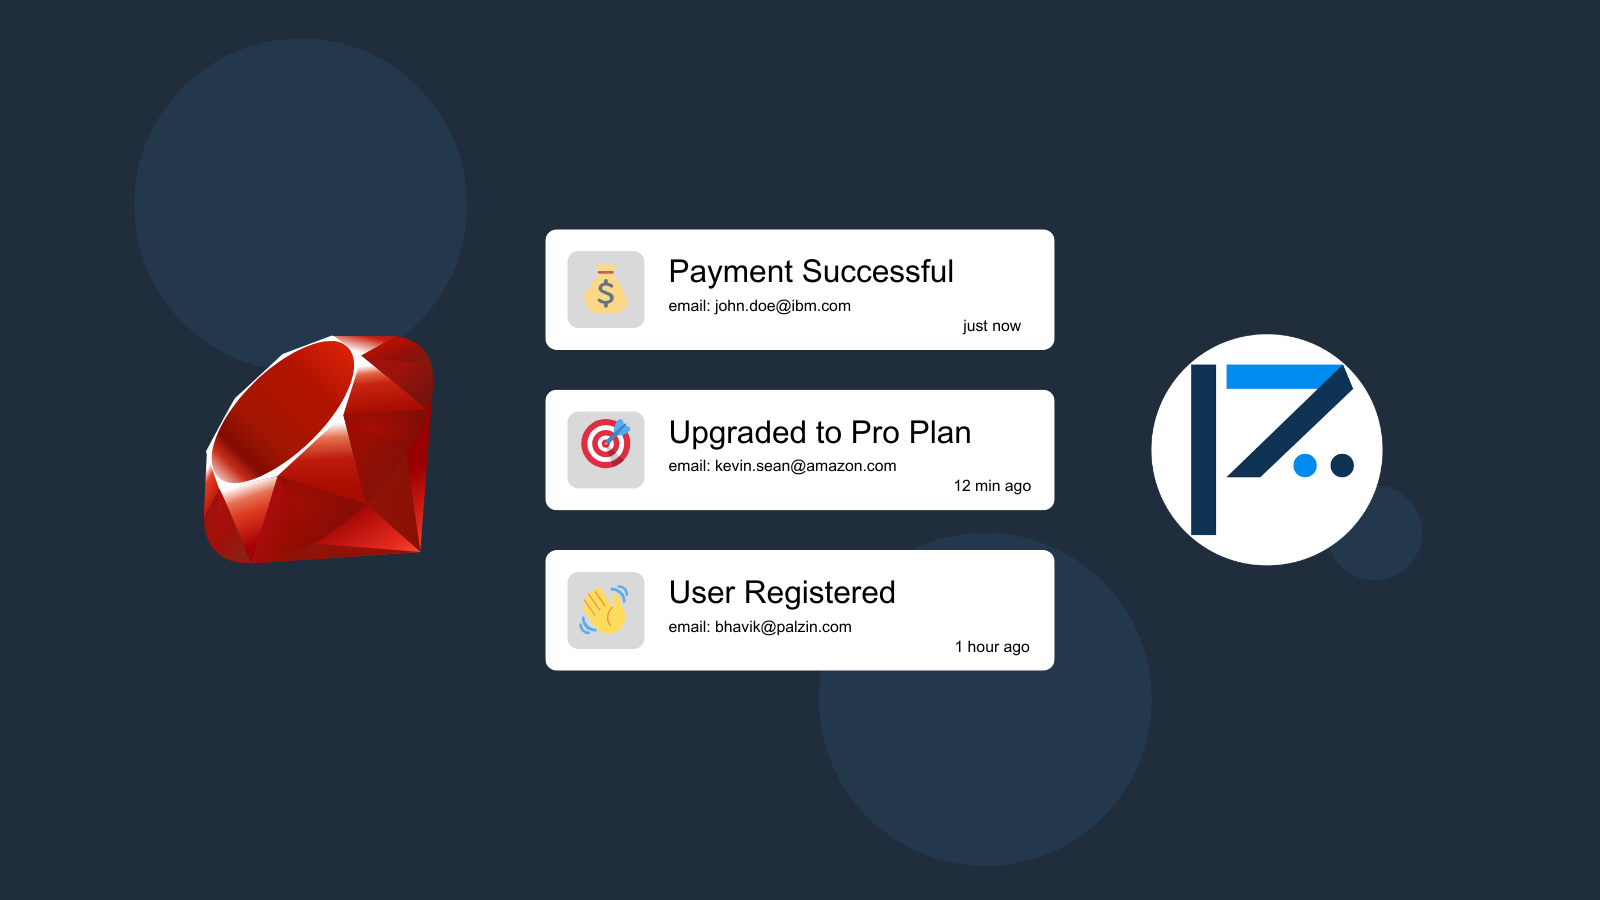
When developing a Ruby application, whether it's intended for public release or private use, security is a top priority for developers. Ensuring the application's security and preventing misuse is crucial.
Misuse of the application can take various forms, including unauthorized data access or improper user actions, posing significant risks such as data loss, corruption, or even theft.
Therefore, it's imperative to establish a robust monitoring system within your Ruby application to detect and address suspicious activities effectively. This monitoring system should keep you and your team informed of any anomalies.
For instance, consider a scenario where you're creating a Ruby application that enables users to upload files. Such applications often face concerns about users attempting to abuse the service by uploading prohibited content, excessively large files, or even malware.
Palzin Track proves to be an invaluable tool in this context, simplifying event tracking and suspicious activity monitoring in your Ruby application. With Palzin Track, you can effortlessly track events, like user file uploads, and configure rules to notify you when a user attempts to upload a file exceeding 100MB. This way, you stay alerted when a user tries to upload an oversized file, allowing you to take necessary actions promptly.
Use the following code snippet to connect Palzin Track to your Ruby application. Make sure to replace the YOUR_API_TOKEN with your API token and update the project and channel names.
Using Ruby with Net::HTTP
require "uri"


require "json"


require "net/http"


url = URI("https://api.palzin.live/v1/log")


https = Net::HTTP.new(url.host, url.port)


https.use_ssl = true


request = Net::HTTP::Post.new(url)


request\["Content-Type"\] = "application/json"


request\["Authorization"\] = "Bearer YOUR_API_TOKEN"


request.body = JSON.dump({


 "project": "my-project",


 "channel": "monitoring",


 "event": "Suspicious File Detected",


 "description": "User uploaded a suspicious file",


 "icon": "🛸",


 "notify": true


})


response = https.request(request)


puts response.read_body
Palzin Track is a flexible and easy-to-use event tracking service that can monitor suspicious activity in your Ruby application. It works excellent with Ruby and provides powerful features such as real-time event tracking, cross-platform push notifications, event filtering, user and product journeys, charts and analytics, and much more.
For example, Palzin Track automatically generates user journeys for your product, and you can use this to see how your users use your application. In addition, in the case of suspicious activity, you can view the user's journey to see if they have performed any other questionable actions that they shouldn't have performed.
Here at Palzin Track, we believe event tracking should be simple and accessible to every developer and team. Therefore, we have worked hard to create the next generation of event tracking tools.
Palzin Track provides a generous free plan to get you started with event tracking. You can also check out our pricing page to see our paid plans. So please give us a try and let us know what you think!
Palzin Track reveals the human stories behind your data. Make user-centric decisions that drive growth.