05, Aug 2023

TRACK CRON JOBS WITH RUBY LANGUAGE

Palzin Track Ruby Use Cases

Track your Ruby cron jobs

![Track your Ruby cron jobs]

When setting up cron jobs in Ruby, it is usually crucial to keep track of their execution and whether they have been executed successfully or not. Sometimes, a minor failure in a cronjob can cause your Ruby application to stop working correctly. Palzin Track makes it easy to track your cron jobs and their execution status all in real-time, and it works seamlessly with your Ruby code.

Connect Palzin Track to Ruby


Setting up your account

Setting up Palzin Track with Ruby is very simple!

  1. Create a free Palzin Track account.
  2. Create a new project on your dashboard.
  3. Copy your API token from the settings page.

Ruby code snippets

Once your Palzin Track account is set up, you can use the following code snippets to track your cron jobs. Just replace the YOUR_API_TOKEN with your Palzin Track API token and update your project name.

Using Ruby with Net::HTTP


require "uri"  


require "json"  


require "net/http"  


url = URI("https://api.palzin.live/v1/log")  


https = Net::HTTP.new(url.host, url.port)  


https.use_ssl = true  


request = Net::HTTP::Post.new(url)  


request\["Content-Type"\] = "application/json"  


request\["Authorization"\] = "Bearer YOUR_API_TOKEN"  


request.body = JSON.dump({  


 "project": "my-project",  


 "channel": "cronjobs",  


 "event": "Cronjob Started",  


 "description": "job: email-notifications",  


 "icon": "⏰",  


 "notify": true  


})  


response = https.request(request)  


puts response.read_body

Ruby integration details

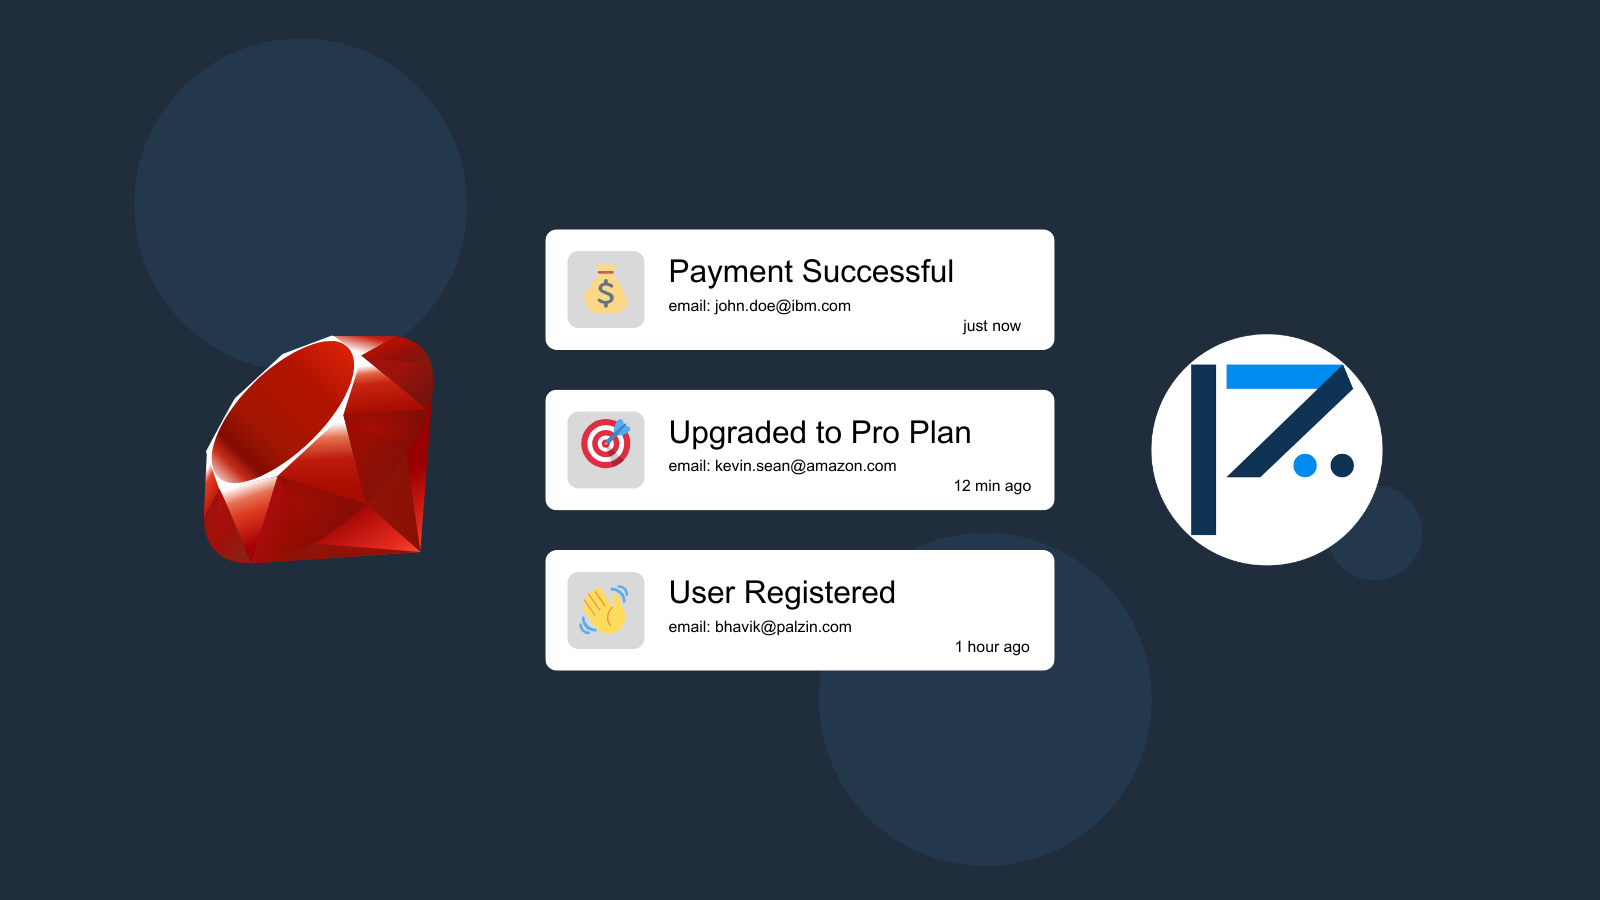
Palzin Track is an easy-to-use event tracking tool that allows you to track any event within your Ruby application. One of the most common use cases for Palzin Track is tracking cron jobs as they are being executed. With Palzin Track, you can receive real-time push notifications on your desktop and mobile devices whenever a new cronjob is executed. In addition, you can create simple charts and filter through your data to help you better understand how your Ruby application is performing.

Other use-cases for Palzin Track

  1. Monitor your CI/CD build status for your Ruby application
  2. Monitor your CPU usage in your Ruby application
  3. Monitor when database goes down in your Ruby application
  4. Monitor high disk usage in your Ruby application
  5. Monitor when a user changes their email address in your Ruby application
  6. Monitor failed logins in your Ruby application
  7. Monitor failed payments for your Ruby application
  8. Monitor memory usage in your Ruby application
  9. Monitor MySQL downtime in your Ruby application
  10. Monitor when a new feature is used in your Ruby application
  11. Monitor your Postgres downtime in your Ruby application
  12. Monitor Redis downtime in your Ruby application
  13. Monitor suspicious activity in your Ruby application
  14. Monitor when a user exceeds the usage limit for your Ruby service
  15. Monitor when a user is being rate limited in your Ruby application
  16. Get a notification when your Ruby code is done executing
  17. Send push notifications to your phone or desktop using Ruby
  18. Track canceled subscriptions in your Ruby application
  19. Track when a file is uploaded to your Ruby application
  20. Track when a form is submitted to your Ruby application
  21. Track payment events via Ruby
  22. Track user sign in events in Ruby
  23. Monitor user signup events via Ruby
  24. Track waitlist signup events via Ruby

Go Beyond the Metrics. Understand the Why.

Palzin Track reveals the human stories behind your data. Make user-centric decisions that drive growth.