When it comes to developing applications in the realm of Python, managing persistent data is a recurring necessity. This can take various forms, such as handling JSON, CSV, or text files on local disks, uploading files to cloud storage solutions like S3 or Google Cloud Storage, or storing data in databases like MongoDB or MySQL. Irrespective of the method chosen, the utilization of disk storage is a pivotal factor for Python applications and has a substantial impact on the user experience.
Hence, it's imperative to implement robust disk usage monitoring for Python applications, whether they are operating in a local environment or residing in the cloud. The significance of this lies in the fact that exceeding a certain disk usage threshold can lead to application crashes and unavailability, resulting in substantial revenue loss and a compromised user experience.
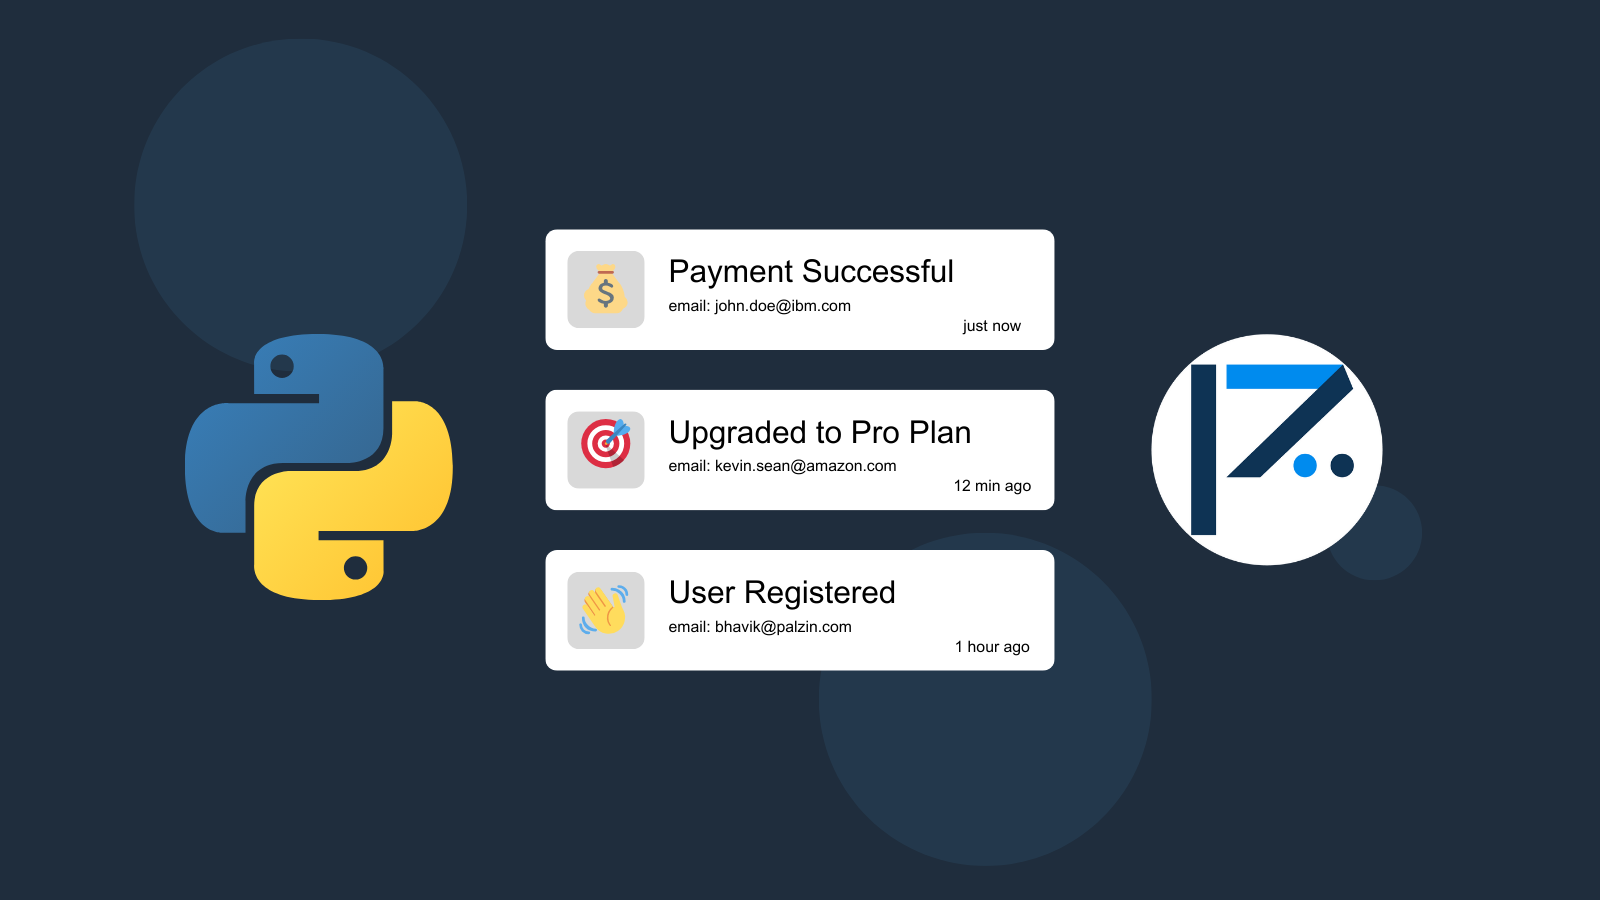
Enter Palzin Track, a potent event tracking tool seamlessly integrated with Python. Palzin Track simplifies the process of tracking crucial events in Python applications in real time. An exemplary use case for Palzin Track involves real-time tracking of disk usage, coupled with the ability to establish alert rules that promptly notify your team when disk usage surpasses predefined thresholds. This proactive approach ensures continuous performance awareness, enabling immediate corrective action when necessary.
Connect Palzin Track to Python
Use the following code to connect Palzin Track to your Python application and track disk usage: Please replace the YOUR_API_TOKEN with your API token and update the project and channel names.
Using Python with http.client
import http.client


import json


conn = http.client.HTTPSConnection("palzin.live")


payload = json.dumps({


 "project": "my-project",


 "channel": "status",


 "event": "High Disk Usage",


 "description": "The disk usage is high.",


 "icon": "💾",


 "notify": True


})


headers = {


 'Content-Type': 'application/json',


 'Authorization': 'Bearer YOUR_API_TOKEN'


}


conn.request("POST", "/api/v1/log", payload, headers)


res = conn.getresponse()


data = res.read()


print(data.decode("utf-8"))
Using Python with Requests
import requests


import json


url = "https://api.palzin.live/v1/log"


payload = json.dumps({


 "project": "my-project",


 "channel": "status",


 "event": "High Disk Usage",


 "description": "The disk usage is high.",


 "icon": "💾",


 "notify": True


})


headers = {


 'Content-Type': 'application/json',


 'Authorization': 'Bearer YOUR_API_TOKEN'


}


response = requests.request("POST", url, headers=headers, data=payload)


print(response.text)
In addition to real-time event tracking, Palzin Track provides powerful features such as cross-platform push notifications, event filtering, user and product journeys, charts, insights, and more. Via Palzin Track, you can get better insight into your Python application and track anything important all in one place and in real time.
We strive to make event tracking simple and accessible to every developer and team. Therefore, we have worked hard to create the next generation of event tracking tools. As a result, Palzin Track is flexible and easy to use, making it a great companion for your Python applications.
Palzin Track reveals the human stories behind your data. Make user-centric decisions that drive growth.