When working on a Python application, managing throttling is a common necessity. Throttling involves restricting the number of requests a user can make to your application, a crucial measure when dealing with high user volumes. For instance, consider a Python application enabling users to upload files; it's prudent to set a limit, like allowing users to upload a maximum of 10 files per minute. Such limitations serve to prevent potential misuse of your service.
Monitoring when throttling is triggered in your Python application is of utmost importance. It can indicate issues in your implementation or even hint at users attempting to exploit your service. Thus, it's essential to establish a robust monitoring system to detect throttle triggers and promptly notify you and your team when irregularities occur.
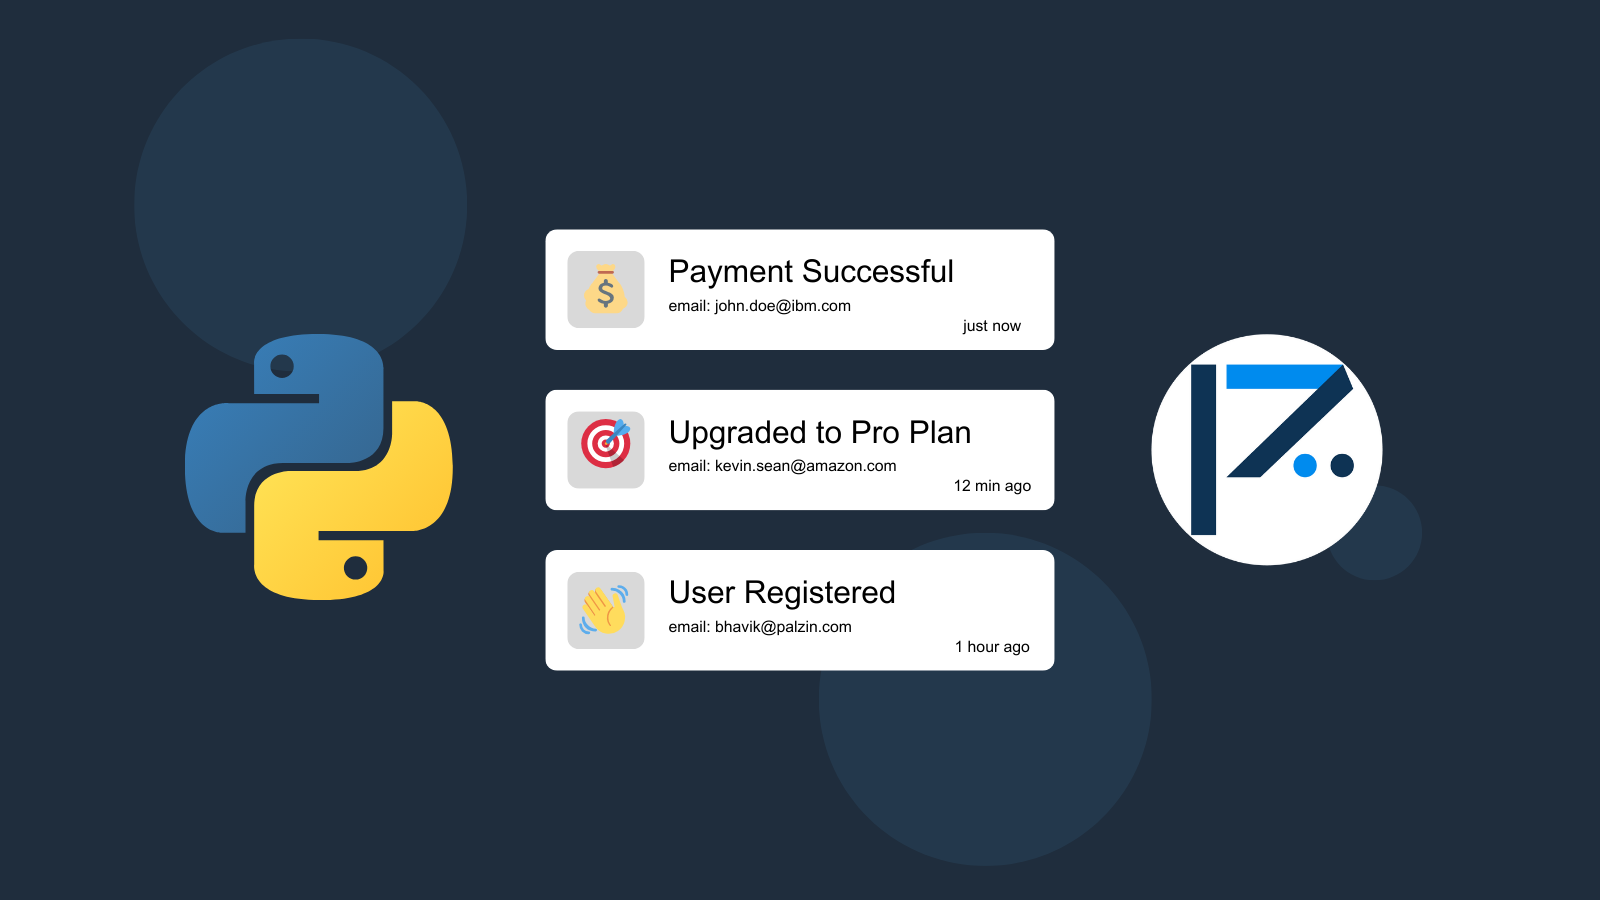
Palzin Track proves to be an invaluable tool for addressing this challenge. It simplifies the process of tracking events within your Python application, making it effortless to monitor throttle occurrences. As an example, you can employ Palzin Track to track the event of a user uploading a file and set up alert rules to notify you when a user reaches the ten-file limit. This approach empowers you to stay informed about user activity and respond effectively when necessary.
Connect Palzin Track to Python
Copy and paste the following code into your Python project. You are required to replace the YOUR_API_TOKEN with your API token and update the project and channel names.
Using Python with http.client
import http.client


import json


conn = http.client.HTTPSConnection("palzin.live")


payload = json.dumps({


 "project": "my-project",


 "channel": "limits",


 "event": "User is being rate limited",


 "description": "User has uploaded more than the allowed amount of files",


 "icon": "⏱",


 "notify": True


})


headers = {


 'Content-Type': 'application/json',


 'Authorization': 'Bearer YOUR_API_TOKEN'


}


conn.request("POST", "/api/v1/log", payload, headers)


res = conn.getresponse()


data = res.read()


print(data.decode("utf-8"))
Using Python with Requests
import requests


import json


url = "https://api.palzin.live/v1/log"


payload = json.dumps({


 "project": "my-project",


 "channel": "limits",


 "event": "User is being rate limited",


 "description": "User has uploaded more than the allowed amount of files",


 "icon": "⏱",


 "notify": True


})


headers = {


 'Content-Type': 'application/json',


 'Authorization': 'Bearer YOUR_API_TOKEN'


}


response = requests.request("POST", url, headers=headers, data=payload)


print(response.text)
When designing Palzin Track, we aimed to create the most simple yet flexible event tracking tool possible. We wanted to make it easy for developers to integrate with their Python applications and to start tracking events in no time.
Today, Palzin Track is what we believe to be the next generation of event tracking. It works excellent with Python and provides powerful features such as real-time event tracking, cross-platform push notifications, event filtering, user and product journeys, charts and analytics, and much more.
Palzin Track provides a free plan to get you started with event tracking, and we can't wait to see how you use it. So please give it a try, and don't hesitate to reach out to us if you have any questions or feedback!
Palzin Track reveals the human stories behind your data. Make user-centric decisions that drive growth.