Postgres, a reliable relational database frequently utilized in Python applications for data persistence and retrieval, offers a wide array of features, rendering it a suitable choice for both small and large-scale applications.
Nonetheless, like any other database system, Postgres is vulnerable to downtime triggered by various factors. Possible causes include hardware failures, network issues, misconfigurations, and more. When such incidents occur, it can disrupt the expected functionality of your application, leading to issues like failed requests and sluggish performance, and in severe cases, data loss.
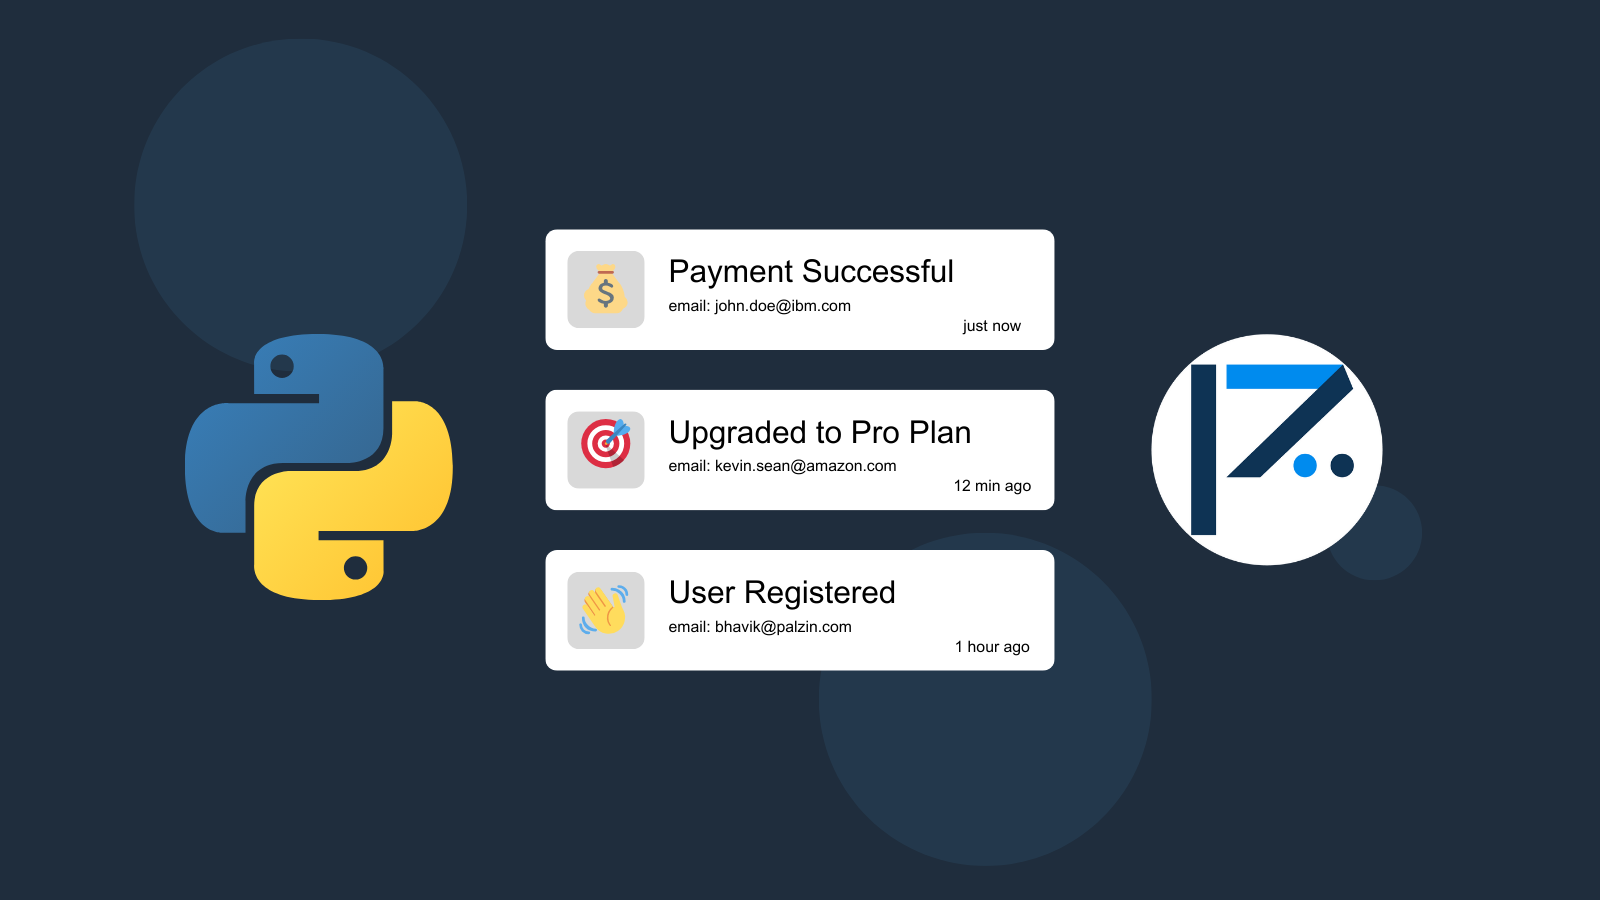
Hence, it is imperative to maintain vigilant monitoring of your database's status and swiftly address any irregularities. Thankfully, Palzin Track simplifies the process of tracking critical events like database downtime and failures. Palzin Track serves as a user-friendly yet potent event tracking tool, designed to log unexpected application behaviors.
For instance, in the context of Postgres, it's common practice to establish periodic checks to ensure the database's operational status, monitoring its performance, disk usage, and memory utilization. Whenever anomalies surface, such as elevated disk usage, performance degradation, or downtime, Palzin Track records these events, immediately notifying your team for prompt action.
Moreover, Palzin Track offers a robust insights dashboard, enabling you to monitor various aspects of your database, including its status, performance, uptime, memory usage, and other customizable metrics. This feature simplifies the task of maintaining your database's overall health and ensures seamless Python application operation. Connect Palzin Track to Python
To track your Postgres downtime, you can use the following code snippet Please don't forget to replace the YOUR_API_TOKEN with your API token and update the project and channel names.
Using Python with http.client
import http.client


import json


conn = http.client.HTTPSConnection("palzin.live")


payload = json.dumps({


 "project": "my-project",


 "channel": "status",


 "event": "Postgres is down",


 "description": "Postgres has been down for the last 5 minutes",


 "icon": "🚨",


 "notify": True


})


headers = {


 'Content-Type': 'application/json',


 'Authorization': 'Bearer YOUR_API_TOKEN'


}


conn.request("POST", "/api/v1/log", payload, headers)


res = conn.getresponse()


data = res.read()


print(data.decode("utf-8"))
Using Python with Requests
import requests


import json


url = "https://api.palzin.live/v1/log"


payload = json.dumps({


 "project": "my-project",


 "channel": "status",


 "event": "Postgres is down",


 "description": "Postgres has been down for the last 5 minutes",


 "icon": "🚨",


 "notify": True


})


headers = {


 'Content-Type': 'application/json',


 'Authorization': 'Bearer YOUR_API_TOKEN'


}


response = requests.request("POST", url, headers=headers, data=payload)


print(response.text)
In addition, Palzin Track provides several powerful features, such as real-time event tracking, push notifications, charts, funnels, and user journey tracking. Furthermore, it works seamlessly with Python and is an excellent tool for monitoring each application part.
Palzin Track provides a generous free plan to get you started with event tracking. You can also check out our pricing page to see our paid plans. So please give us a try and let us know what you think!
Palzin Track reveals the human stories behind your data. Make user-centric decisions that drive growth.